
Need to sell your current home before you can buy your next one? A contingent offer can still win — but only if it's built right.We walk through what makes yours the one a Willamette Valley
Dated: January 8 2024
Views: 112
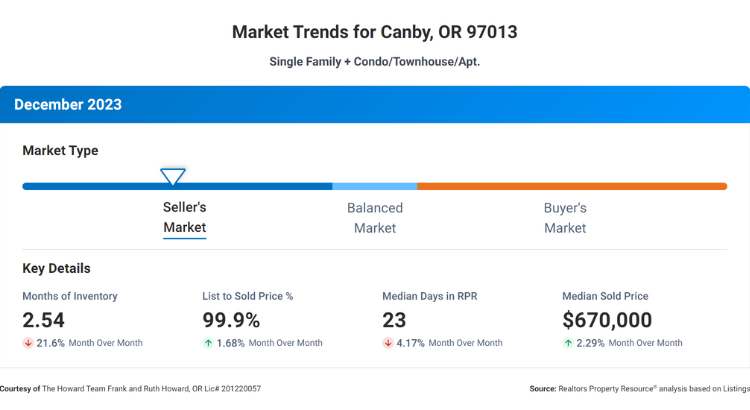
In the real estate market, there are several key metrics that can provide valuable insights for both buyers and sellers. Let's take a closer look at the correlation between the following metrics: Months Supply of Inventory, 12-Month Change in Months of Inventory, Median Days Homes are On the Market, List to Sold Price Percentage, and Median Sold Price.
The Months Supply of Inventory is currently at 2.54. This metric represents the number of months it would take to sell all the available homes on the market, given the current sales pace. A lower number indicates a seller's market, where demand is high and supply is limited. In this case, the relatively low supply suggests a competitive market with fewer options for buyers.
The 12-Month Change in Months of Inventory is -11.81%. This metric measures the percentage change in the supply of inventory over the past year. A negative value indicates a decrease in inventory, which suggests a tightening market. In this scenario, the decrease in months of inventory implies that the number of available homes has decreased, further contributing to a seller's market.
The Median Days Homes are On the Market is 23. This metric represents the average number of days it takes for a home to sell after it is listed. A lower number indicates a faster-selling market, where homes are in high demand. In this case, the relatively low median days on the market suggests that homes are selling quickly, reinforcing the notion of a seller's market.
The List to Sold Price Percentage is 99.9%. This metric measures the percentage of the listing price that a home ultimately sells for. A higher percentage indicates that homes are selling close to their asking prices. In this scenario, the high list to sold price percentage suggests that sellers are receiving offers close to their asking prices, which can be beneficial for sellers.
Lastly, the Median Sold Price is $670,000. This metric represents the middle point of all the sold prices of homes in a given area. It provides an indication of the overall price range and market value. In this case, the median sold price of $670,000 suggests that the market has relatively higher-priced homes.
Overall, these metrics paint a picture of a competitive seller's market with limited supply, high demand, and homes selling quickly at prices close to their listing prices. For buyers, it indicates a need to act quickly and potentially be prepared to make competitive offers. For sellers, it suggests a favorable market where homes are selling quickly and close to their asking prices.
We hope this information helps you better understand the Canby real estate market. If you'd like to learn more about the real estate market in a different area, we'd be happy to provide you with the details!

Welcome — we’re glad you’re here.We’re Ruth and Frank Howard, known locally as Your Howard Team, and we help homeowners across the Willamette Valley make smart, confident real ....
Need to sell your current home before you can buy your next one? A contingent offer can still win — but only if it's built right.We walk through what makes yours the one a Willamette Valley
A contingent offer on your home isn't automatically a risk — but it does come with real tradeoffs worth understanding before you sign.Here's how Oregon's contingency structure protects,
Buying a home where the seller is signing under power of attorney? The legal ground rules haven't changed — but where you focus your due diligence should.Here's what buyers in the Willamette
Selling Mom or Dad's house under power of attorney? Here's what actually changes in the transaction — from disclosure requirements to closing — and what doesn't.Read our full blog
 All information provided is deemed reliable but is not guaranteed and should be independently verified. IDX information is provided exclusively for consumers' personal, non-commercial use, that it may not be used for any purpose other than to identify prospective properties consumers may be interested in purchasing, and that the data is deemed reliable but is not guaranteed accurate by RMLSTM.
The content relating to real estate for sale on this web site comes in part from the IDX program of the RMLSTM of Portland, Oregon. Real estate listings held by brokerage firms other than Equity Oregon Real Estate are marked with the RMLSTM logo, and detailed information about these properties includes the names of the listing brokers. Listing content is copyright © 2026 RMLSTM, Portland, Oregon.
This content last updated on September 21, 2026 1:28 PM UTC at 4 AM. Some properties which appear for sale on this web site may subsequently have sold or may no longer be available.
All information provided is deemed reliable but is not guaranteed and should be independently verified. IDX information is provided exclusively for consumers' personal, non-commercial use, that it may not be used for any purpose other than to identify prospective properties consumers may be interested in purchasing, and that the data is deemed reliable but is not guaranteed accurate by RMLSTM.
The content relating to real estate for sale on this web site comes in part from the IDX program of the RMLSTM of Portland, Oregon. Real estate listings held by brokerage firms other than Equity Oregon Real Estate are marked with the RMLSTM logo, and detailed information about these properties includes the names of the listing brokers. Listing content is copyright © 2026 RMLSTM, Portland, Oregon.
This content last updated on September 21, 2026 1:28 PM UTC at 4 AM. Some properties which appear for sale on this web site may subsequently have sold or may no longer be available.
